
How Fuzzing works? The dummy Fuzzer.
The easy way to describe fuzzing is to compare it to the process of unit testing a program, but with different input. This input can be random, or it can be generated in some way that makes it unexpected form standard execution perspective.
The simplest 'fuzzer' can be written in few lines of bash, by getting N bytes from /dev/rand, and putting them to the program as a parameter.

Coverage and Fuzzing
What can be done to make fuzzing more effective? If we think about fuzzing as a process, where we place data into the input of the program (which is a black box), and we can only interact via input, not much more can be done.
However, programs usually process different inputs at different speeds, which can give us some insight into the program's behavior. During fuzzing, we are trying to crash the program, thus we need additional probes to observe the program's behaviour.
Additional knowledge about program state can be exploited as a feedback loop for generating new input vectors. Knowledge about the program itself and the structure of input data can also be considered. As an example, if the input data is in the form of HTML, changing characters inside the body will probably cause less problems for the parser than experimenting with headers and HTML tags.
For open source programs, we can read the source code to know what input takes which execution path. Nonetheless, this might be very time consuming, and it would be much more helpful if this can be automated. As it turns out, this process can be improved by tracing coverage of the execution.

AFL (American Fuzzy Lop) is one of the first successful fuzzers. It uses a technique where the program is compiled with injected traces for every execution branch instruction. During the program execution, every branch is counted, and the analyzer builds a graph out of execution paths and then explores different "interesting" paths.
Now, fuzzing has become a mainstream technique, and compilers provide an option to embed fuzzing hooks at compilation time via switches.
The same process can be applied to the kernel world. However, it would be quite hard to run another program on the same machine outside of the kernel to read these counters. Because of that, they usually are made available inside the kernel.
To illustrate how that is done, we can compile a hello world program written in C for tracing the Program Counter (PC).
gcc main.c -fsanitize-coverage=trace-pc

/usr/local/bin/ld: /tmp/ccIKK7Eo.o: in function `handler':
main.c:(.text+0xd): undefined reference to `__sanitizer_cov_trace_pc'
/usr/local/bin/ld: main.c:(.text+0x1b): undefined reference to `__sanitizer_cov_trace_pc'
The compiler added additional references to the __sanitizer_cov_trace_pc, but we didn't implement them, or link with something else to provide the implementation. If we grep the head of the NetBSD kernel sources for the same function, we will find within sys/kern/subr_kcov.c an implementation: kcov(4).
Which Fuzzer should I choose?
In recent years, AFL has grown into an industry standard. Many projects have integrated it into their development process. This has caused many different bugs and issues to be found and fixed in a broad spectrum of projects (see AFL website for examples). As this technique has become mainstream, many people have started developing custom fuzzers. Some of them were just modified clones of AFL, but there were also many different and innovative approaches. Connecting a custom fuzzer or testing some unusual execution path is no longer considered as just a hackathon project, but part of security research.
I personally believe that we are still in the early state of fuzzing. A lot of interesting work and research is already available, but we cannot explain or prove why one way is better than another one, or how the reference fuzzer should work, and what are its technical specifications.
Many approaches have been developed to do efficient fuzzing, and many bugs have been reported, but most of the knowledge comes still from empirical experiments and comparison between different techniques.
Modular kcov inside the kernel
Coverage metrics inside kernel became a standard even before the fuzzing era. A primary use-case of coverage is not fuzzing, but testing, and measuring test coverage. While code coverage is well understood, kernel fuzzing is still kind of a Wild West, where most of the projects have their own techniques. There are some great projects with a large community around them, like Honggfuzz and Syzkaller. Various companies and projects manitain several fuzzers for kernel code. This shows us that as a kernel community, we need to be open and flexible for different approaches, that allow people interested in fuzzing to do their job efficiently. In return, various fuzzers can find different sets of bugs and improve the overall quality of our kernel.
In the past, Oracle made some effort to upstream an interface for AFL inside Linux kernel (see the patch here. However, the patches were rejected via the kernel community for various reasons.
We did our own research on the needs of fuzzers in context of kcov(4) internals, and quickly figured out that per-fuzzer changes in the main code do not scale up, and can leave unused code inside the kernel driver.
In NetBSD, we want to be compatible with AFL, Hongfuzz, Syzkaller and few other fuzzers, so keeping all fuzzer specific data inside one module would be hard to maintain.
One idea that we had was to keep raw coverage data inside the kernel, and process it inside the user space fuzzer module. Unfortunately, we found that current coverage verbosity in the NetBSD kernel is higher than in Linux, and more advanced traces can have thousand of entries. One of the main requirements for fuzzers is performance. If the fuzzer is slow, even if it is smarter than others, it will most likely will find fewer bugs. If it is significantly slower, then it is not useful at all. We found that storing raw kernel traces in kcov(4), copying the data into user-space, and transfoming it into the AFL format, is not an option. The performance suffers, and the fuzzing process becomes very slow, making it not useful in practice.
We decided to keep AFL conversion of the data inside the kernel, and not introduce too much complexity to the coverage part. As a current proof of concept API, we made kcov more modular, allowing different modules to implement functionality outside of the core requirements. The current code can be viewed here or on the GitHub.
KCOV Modules
As we mentioned earlier, coverage data available in the kernel is generated during tracing by one of the hooks enabled by the compiler. Currently, NetBSD supports PC and CMP tracing. The Kcov module can gather this data during the trace, convert it and expose to the user space via mmap. To write our own coverage module for new PoC API, we need to provide such operations as: open, free, enable, disable, mmap and handling traces.
This can be done via using kcov_ops structure:
static struct kcov_ops kcov_mod_ops = {
	.open = kcov_afl_open,
	.free = kcov_afl_free,
	.setbufsize = kcov_afl_setbufsize,
	.enable = kcov_afl_enable,
	.disable = kcov_afl_disable,
	.mmap = kcov_afl_mmap,
	.cov_trace_pc = kcov_afl_cov_trace_pc,
	.cov_trace_cmp = kcov_afl_cov_trace_cmp
};
During load or unload, the module must to run kcov_ops_set or kcov_ops_unset. After set, default kcov_ops are overwritten via the module. After unset, they are returned to the default.
Porting AFL as a module
The next step would be to develop a sub-module compatible with the AFL fuzzer.
To do that, the module would need to expose a buffer to user space, and from kernelspace would need to keep information about the 64kB SHM region, previous PC, and thread id. The thread id is crucial, as usually fuzzing runs few tasks. This data is gathered inside the AFL context structure:
typedef struct afl_ctx {
	uint8_t *afl_area;
	struct uvm_object *afl_uobj;
	size_t afl_bsize;
	uint64_t afl_prev_loc;
	lwpid_t lid;
} kcov_afl_t;
The most important part of the integration is to translate the execution shadow, a list of previous PCs along the execution path, to the AFL compatible hash-map, which is a pair of (prev PC, PC). That can be done according to the documentation of AFL by this method:
++afl->afl_area[(afl->afl_prev_loc ^ pc) & (bsize-1)];
afl->afl_prev_loc = pc;

In our implementation, we use a trick by Quentin Casasnovas of Oracle to improve the distribution of the counters, by storing the hashed PC pairs instead of raw.
The rest of operations, like open, mmap, and enable, can be reviewed in the GitHub repository together with the testing code that dumps 64kB of SHM data.
Debug your fuzzer
Everyone knows that kernel debugging is more complicated than programs running in the user space. Many tools can be used for doing that, and there is always a discussion about usability vs complexity of the setup. People tend to be divided into two groups: those that prefer to use a complicated setup like kernel debugger (with remote debugging), and those for which tools like printf and other simple debug interfaces are sufficient enough.

Enabling coverage brings even more complexity to kernel debugging. Everyone's favourite printf also becomes traced, so putting it inside the trace function will result in a stack overflow. Also, touching any kcov internal structures becomes very tricky and, should be avoided if possible.
A debugger is still a sufficient tool. However, as we mentioned earlier, trace functions are called for every branch, which can be translated to thousand or even tens of thousand break points before any specific condition will occur.
I am personally more of a printf than gdb guy, and in most cases, the ability to print variables' contents is enough to find the issues. For validating my AFL kcov plugin, I found out that debugcon_printf written by Kamil Rytarowski is a great tool.
Example of debugcon_printf
To illustrate that idea, lets say that we want to print every PC trace that comes to our AFL submodule.
The most intuitive way would be put printf("#:%p\n", pc) at very beginning of the kcov_afl_cov_trace_pc, but as mentioned earlier, such a trick would end up with a kernel crash whenever we enable tracing with our module. However, if we switch printf to the debugcon_printf, and add a simple option to our QEMU:
-debugcon file:/tmp/qemu.debug.log -global isa-debugcon.iobase=0xe9
we can see on our host machine that all traces are written to the file qemu.debug.log.
kcov_afl_cov_trace_pc(void *priv, intptr_t pc) {
	kcov_afl_t *afl = priv;

	debugcon_printf("#:%x\n", pc);

	++afl->afl_area[(afl->afl_prev_loc ^ pc) & (afl->afl_bsize-1)];
	afl->afl_prev_loc = _long_hash64(pc, BITS_PER_LONG);

	return;
}
Future work
The AFL submodule was developed as part of the AFL FileSystems Fuzzing project to simplify the fuzzing of different parts of the NetBSD kernel.
I am using it currently for fuzzing different filesystems. In a future article I plan to show more practical examples.
Another great thing to do will be to refactor KLEAK, which is using PC trace data and is disconnected from kcov. A good idea would be to rewrite it as a kcov module, to have one unified way to access coverage data inside NetBSD kernel.
Summary
In this article, we familiarized the reader with the technique of fuzzing, starting from theoretical background up to the level of kernel fuzzing.
Based on these pieces of information, we demonstrated the purpose of the a modular coverage framework inside the kernel and an example implementation of submodule that can be consumed by AFL.
More details can be learned via downloading and trying the sample code shown in the example.
At the end of this article, I want to thank Kamil, for such a great idea for a project, and for allowing me to work on NetBSD development.
How Fuzzing works? The dummy Fuzzer.
The easy way to describe fuzzing is to compare it to the process of unit testing a program, but with different input. This input can be random, or it can be generated in some way that makes it unexpected form standard execution perspective.
The simplest 'fuzzer' can be written in few lines of bash, by getting N bytes from /dev/rand, and putting them to the program as a parameter.
Coverage and Fuzzing
What can be done to make fuzzing more effective? If we think about fuzzing as a process, where we place data into the input of the program (which is a black box), and we can only interact via input, not much more can be done.
However, programs usually process different inputs at different speeds, which can give us some insight into the program's behavior. During fuzzing, we are trying to crash the program, thus we need additional probes to observe the program's behaviour.
Additional knowledge about program state can be exploited as a feedback loop for generating new input vectors. Knowledge about the program itself and the structure of input data can also be considered. As an example, if the input data is in the form of HTML, changing characters inside the body will probably cause less problems for the parser than experimenting with headers and HTML tags.
For open source programs, we can read the source code to know what input takes which execution path. Nonetheless, this might be very time consuming, and it would be much more helpful if this can be automated. As it turns out, this process can be improved by tracing coverage of the execution.
AFL (American Fuzzy Lop) is one of the first successful fuzzers. It uses a technique where the program is compiled with injected traces for every execution branch instruction. During the program execution, every branch is counted, and the analyzer builds a graph out of execution paths and then explores different "interesting" paths.
Now, fuzzing has become a mainstream technique, and compilers provide an option to embed fuzzing hooks at compilation time via switches.
The same process can be applied to the kernel world. However, it would be quite hard to run another program on the same machine outside of the kernel to read these counters. Because of that, they usually are made available inside the kernel.
To illustrate how that is done, we can compile a hello world program written in C for tracing the Program Counter (PC).
gcc main.c -fsanitize-coverage=trace-pc

/usr/local/bin/ld: /tmp/ccIKK7Eo.o: in function `handler':
main.c:(.text+0xd): undefined reference to `__sanitizer_cov_trace_pc'
/usr/local/bin/ld: main.c:(.text+0x1b): undefined reference to `__sanitizer_cov_trace_pc'
The compiler added additional references to the __sanitizer_cov_trace_pc, but we didn't implement them, or link with something else to provide the implementation. If we grep the head of the NetBSD kernel sources for the same function, we will find within sys/kern/subr_kcov.c an implementation: kcov(4).
Which Fuzzer should I choose?
In recent years, AFL has grown into an industry standard. Many projects have integrated it into their development process. This has caused many different bugs and issues to be found and fixed in a broad spectrum of projects (see AFL website for examples). As this technique has become mainstream, many people have started developing custom fuzzers. Some of them were just modified clones of AFL, but there were also many different and innovative approaches. Connecting a custom fuzzer or testing some unusual execution path is no longer considered as just a hackathon project, but part of security research.
I personally believe that we are still in the early state of fuzzing. A lot of interesting work and research is already available, but we cannot explain or prove why one way is better than another one, or how the reference fuzzer should work, and what are its technical specifications.
Many approaches have been developed to do efficient fuzzing, and many bugs have been reported, but most of the knowledge comes still from empirical experiments and comparison between different techniques.
Modular kcov inside the kernel
Coverage metrics inside kernel became a standard even before the fuzzing era. A primary use-case of coverage is not fuzzing, but testing, and measuring test coverage. While code coverage is well understood, kernel fuzzing is still kind of a Wild West, where most of the projects have their own techniques. There are some great projects with a large community around them, like Honggfuzz and Syzkaller. Various companies and projects manitain several fuzzers for kernel code. This shows us that as a kernel community, we need to be open and flexible for different approaches, that allow people interested in fuzzing to do their job efficiently. In return, various fuzzers can find different sets of bugs and improve the overall quality of our kernel.
In the past, Oracle made some effort to upstream an interface for AFL inside Linux kernel (see the patch here. However, the patches were rejected via the kernel community for various reasons.
We did our own research on the needs of fuzzers in context of kcov(4) internals, and quickly figured out that per-fuzzer changes in the main code do not scale up, and can leave unused code inside the kernel driver.
In NetBSD, we want to be compatible with AFL, Hongfuzz, Syzkaller and few other fuzzers, so keeping all fuzzer specific data inside one module would be hard to maintain.
One idea that we had was to keep raw coverage data inside the kernel, and process it inside the user space fuzzer module. Unfortunately, we found that current coverage verbosity in the NetBSD kernel is higher than in Linux, and more advanced traces can have thousand of entries. One of the main requirements for fuzzers is performance. If the fuzzer is slow, even if it is smarter than others, it will most likely will find fewer bugs. If it is significantly slower, then it is not useful at all. We found that storing raw kernel traces in kcov(4), copying the data into user-space, and transfoming it into the AFL format, is not an option. The performance suffers, and the fuzzing process becomes very slow, making it not useful in practice.
We decided to keep AFL conversion of the data inside the kernel, and not introduce too much complexity to the coverage part. As a current proof of concept API, we made kcov more modular, allowing different modules to implement functionality outside of the core requirements. The current code can be viewed here or on the GitHub.
KCOV Modules
As we mentioned earlier, coverage data available in the kernel is generated during tracing by one of the hooks enabled by the compiler. Currently, NetBSD supports PC and CMP tracing. The Kcov module can gather this data during the trace, convert it and expose to the user space via mmap. To write our own coverage module for new PoC API, we need to provide such operations as: open, free, enable, disable, mmap and handling traces.
This can be done via using kcov_ops structure:
static struct kcov_ops kcov_mod_ops = {
	.open = kcov_afl_open,
	.free = kcov_afl_free,
	.setbufsize = kcov_afl_setbufsize,
	.enable = kcov_afl_enable,
	.disable = kcov_afl_disable,
	.mmap = kcov_afl_mmap,
	.cov_trace_pc = kcov_afl_cov_trace_pc,
	.cov_trace_cmp = kcov_afl_cov_trace_cmp
};
During load or unload, the module must to run kcov_ops_set or kcov_ops_unset. After set, default kcov_ops are overwritten via the module. After unset, they are returned to the default.
Porting AFL as a module
The next step would be to develop a sub-module compatible with the AFL fuzzer.
To do that, the module would need to expose a buffer to user space, and from kernelspace would need to keep information about the 64kB SHM region, previous PC, and thread id. The thread id is crucial, as usually fuzzing runs few tasks. This data is gathered inside the AFL context structure:
typedef struct afl_ctx {
	uint8_t *afl_area;
	struct uvm_object *afl_uobj;
	size_t afl_bsize;
	uint64_t afl_prev_loc;
	lwpid_t lid;
} kcov_afl_t;
The most important part of the integration is to translate the execution shadow, a list of previous PCs along the execution path, to the AFL compatible hash-map, which is a pair of (prev PC, PC). That can be done according to the documentation of AFL by this method:
++afl->afl_area[(afl->afl_prev_loc ^ pc) & (bsize-1)];
afl->afl_prev_loc = pc;
In our implementation, we use a trick by Quentin Casasnovas of Oracle to improve the distribution of the counters, by storing the hashed PC pairs instead of raw.
The rest of operations, like open, mmap, and enable, can be reviewed in the GitHub repository together with the testing code that dumps 64kB of SHM data.
Debug your fuzzer
Everyone knows that kernel debugging is more complicated than programs running in the user space. Many tools can be used for doing that, and there is always a discussion about usability vs complexity of the setup. People tend to be divided into two groups: those that prefer to use a complicated setup like kernel debugger (with remote debugging), and those for which tools like printf and other simple debug interfaces are sufficient enough.
Enabling coverage brings even more complexity to kernel debugging. Everyone's favourite printf also becomes traced, so putting it inside the trace function will result in a stack overflow. Also, touching any kcov internal structures becomes very tricky and, should be avoided if possible.
A debugger is still a sufficient tool. However, as we mentioned earlier, trace functions are called for every branch, which can be translated to thousand or even tens of thousand break points before any specific condition will occur.
I am personally more of a printf than gdb guy, and in most cases, the ability to print variables' contents is enough to find the issues. For validating my AFL kcov plugin, I found out that debugcon_printf written by Kamil Rytarowski is a great tool.
Example of debugcon_printf
To illustrate that idea, lets say that we want to print every PC trace that comes to our AFL submodule.
The most intuitive way would be put printf("#:%p\n", pc) at very beginning of the kcov_afl_cov_trace_pc, but as mentioned earlier, such a trick would end up with a kernel crash whenever we enable tracing with our module. However, if we switch printf to the debugcon_printf, and add a simple option to our QEMU:
-debugcon file:/tmp/qemu.debug.log -global isa-debugcon.iobase=0xe9
we can see on our host machine that all traces are written to the file qemu.debug.log.
kcov_afl_cov_trace_pc(void *priv, intptr_t pc) {
	kcov_afl_t *afl = priv;

	debugcon_printf("#:%x\n", pc);

	++afl->afl_area[(afl->afl_prev_loc ^ pc) & (afl->afl_bsize-1)];
	afl->afl_prev_loc = _long_hash64(pc, BITS_PER_LONG);

	return;
}
Future work
The AFL submodule was developed as part of the AFL FileSystems Fuzzing project to simplify the fuzzing of different parts of the NetBSD kernel.
I am using it currently for fuzzing different filesystems. In a future article I plan to show more practical examples.
Another great thing to do will be to refactor KLEAK, which is using PC trace data and is disconnected from kcov. A good idea would be to rewrite it as a kcov module, to have one unified way to access coverage data inside NetBSD kernel.
Summary
In this article, we familiarized the reader with the technique of fuzzing, starting from theoretical background up to the level of kernel fuzzing.
Based on these pieces of information, we demonstrated the purpose of the a modular coverage framework inside the kernel and an example implementation of submodule that can be consumed by AFL.
More details can be learned via downloading and trying the sample code shown in the example.
At the end of this article, I want to thank Kamil, for such a great idea for a project, and for allowing me to work on NetBSD development.
Debugger related changes
NetBSD might be the only mainstream OS that implements posix_spawn(3) with a dedicated syscall. All the other recognized kernels have an implementation as a libc wrapper around either fork(2), vfork(2) or clone(2). I've introduced a new ptrace(2) event, PTRACE_POSIX_SPAWN, improved the posix_spawn(3) documentation, and introduced new ATF regression tests for posix_spawn(3).
The new ptrace(2) code has been exercised under load with LLDB test-suite, picotrace, and NetBSD truss.
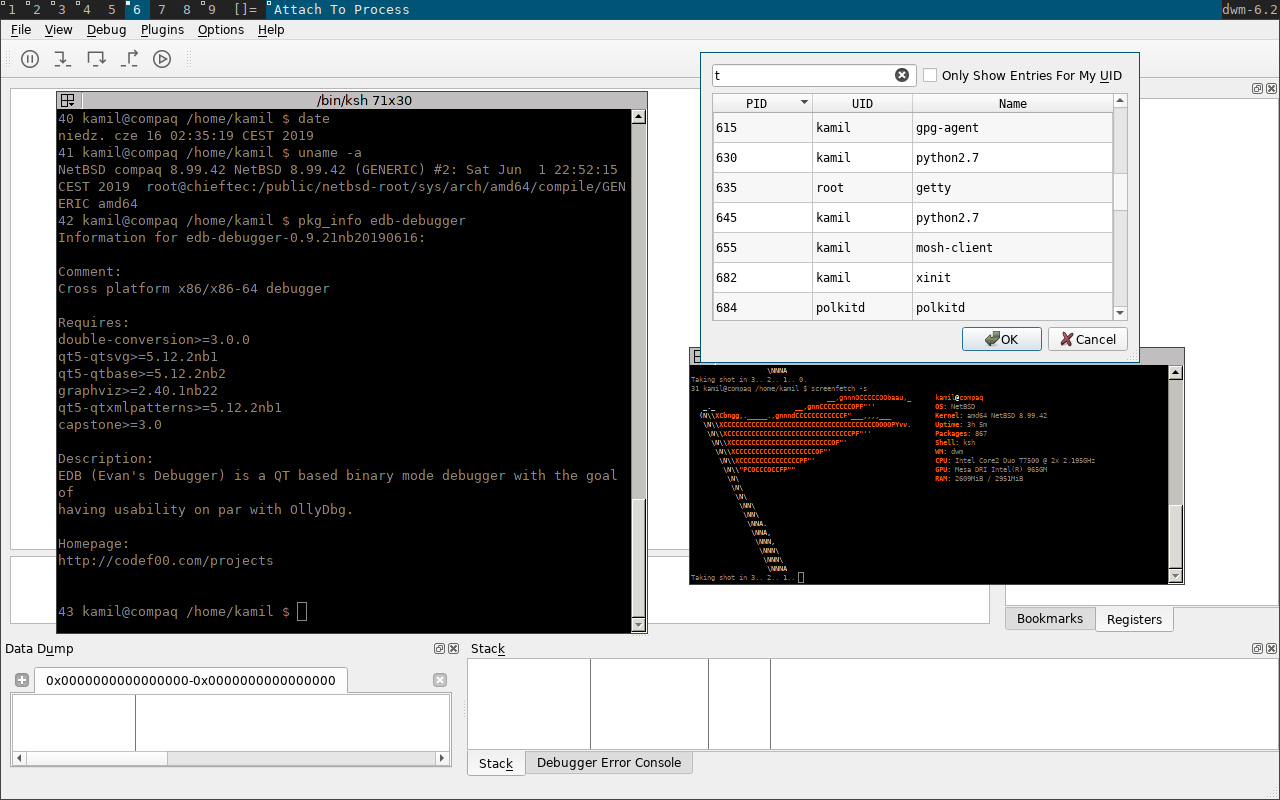
I intend to resume porting of edb-debugger from work I began two years ago. I hope to use it for verifying FPU registers. I've spent some time porting this debugger to NetBSD/amd64 and managed to get a functional process attached. Unfortunately the code is highly specific to a single Operating System. That OS is the only one that is really functional at the moment and the code needs rework to be more agnostic with respect to the different semantics of kernels.
Issues with threaded debugging
I've analyzed the problems with multiple thread programs under debuggers. They could be classified into the following groups:
- There is suboptimal support in GDB/NetBSD. However, events such as software breakpoint, watchpoint, and single step trap are reported correctly by the kernel. A debugger can detect the exact reason of interruption of execution. Unfortunately, the current NetBSD code tries to be compatible with Linux which prevents the NetBSD kernel from being able to precisely point to the stop reason. This causes GDB to randomly misbehave, e.g. single step over forking code.
- Events reported from two or more events compete in the kernel for being reported to a debugger. A selection of events that lost this race will not be delivered as the winner event will overwrite signal information for a debugger from losing threads/events.
- PT_RESUME/PT_SUSPEND shares the same suspended bit as pthread_suspend_np(3) and pthread_resume_np(3) (_lwp_suspend(2), _lwp_continue(2)).
- In some circumstances event from an exiting thread never hits the tracer (WAIT() vs LWP_EXIT() race).
- Corner cases that can cause a kernel crash or kill trace can negatively effect the debugging process.
I've found that focusing on kernel correctness now and fixing thread handling bugs can have paradoxically random impact on GDB/NetBSD. The solution for multiple events reported from multiple threads concurrently has a fix in progress, but the initial changes caused some fallout in GDB support so I have decided to revert it for now. This pushed me to the conclusion that before fixing LWP events, there is a priority to streamline the GDB support: modernize it, upstream it, run regression tests.
Meanwhile there is an ongoing work on covering more kernel code paths with fuzzers. We will catch and address problems out there only because they're able to be found. I'm supervising 3 ongoing projects in this domain: syzkaller support enhancements, TriforceAFL porting and AFL+KCOV integration. This work makes the big picture of what is still needed to be fixed clearer and lowers the cost of improving the quality.
LSan/NetBSD
The original implementation of Leak Sanitizer for NetBSD was developed for GCC by Christos Zoulas. The whole magic of a functional LSan software is the Stop-The-World operation. This means that a process suspends all other threads while having the capability to investigate the register frame and the stacks of suspended threads.
Until recently there were two implementations of LSan: for Linux (ab)using ptrace(2) and for Darwin using low-level Mach interfaces. Furthermore the Linux version needs a special version of fork(2) and makes assumptions about the semantics of the signal kernel code.
The original Linux code must separately attach to each thread via a pid. This applies to all other operations, such as detaching or killing a process through ptrace(2). Additionally listing threads of a debugged process on Linux is troublesome as there is need to iterate through directories in /proc.
The implementation in GCC closely reused the semantics of Linux. There was room for enhancement. I've picked this code as an inspiration and wrote a clean implementation reflecting the NetBSD kernel behavior and interfaces. In the end the NetBSD code is simpler than the Linux code without needing any recovery fallbacks or port specific kludges (in Linux every CPU needs discrete treatment.)
Much to my chagrin, this approach abuses the ptrace(2) interface, making sanitizing for leaking programs incompatible with debuggers. The whole StopTheWorld() operation could be cleanly implemented on the kernel side as a new syscall. I have a semicompleted implementation of this syscall, however I really want to take care of all threading issues under ptrace(2) before moving on. The threading issues must be fully reliable in one domain of debugging before implementing other kernel code. Both LLVM 9.0 and NetBSD-9 are branching soon and it will be a good enough solution for the time being. My current goal before the LLVM branching is to address a semantic behavioral difference in atexit(3) that raises a false positive in LSan tests. Request for comments on this specific atexit(3) issue will be available pending feedback from upstream.
Plan for the next milestone
Modernize GDB/NetBSD support, upstream it, and run GDB regression tests for NetBSD/amd64. Switch back to addressing threading kernel issues under a debugger.
This work was sponsored by The NetBSD Foundation.
The NetBSD Foundation is a non-profit organization and welcomes any donations to help us continue funding projects and services to the open-source community. Please consider visiting the following URL to chip in what you can:
Debugger related changes
NetBSD might be the only mainstream OS that implements posix_spawn(3) with a dedicated syscall. All the other recognized kernels have an implementation as a libc wrapper around either fork(2), vfork(2) or clone(2). I've introduced a new ptrace(2) event, PTRACE_POSIX_SPAWN, improved the posix_spawn(3) documentation, and introduced new ATF regression tests for posix_spawn(3).
The new ptrace(2) code has been exercised under load with LLDB test-suite, picotrace, and NetBSD truss.
I intend to resume porting of edb-debugger from work I began two years ago. I hope to use it for verifying FPU registers. I've spent some time porting this debugger to NetBSD/amd64 and managed to get a functional process attached. Unfortunately the code is highly specific to a single Operating System. That OS is the only one that is really functional at the moment and the code needs rework to be more agnostic with respect to the different semantics of kernels.
Issues with threaded debugging
I've analyzed the problems with multiple thread programs under debuggers. They could be classified into the following groups:
- There is suboptimal support in GDB/NetBSD. However, events such as software breakpoint, watchpoint, and single step trap are reported correctly by the kernel. A debugger can detect the exact reason of interruption of execution. Unfortunately, the current NetBSD code tries to be compatible with Linux which prevents the NetBSD kernel from being able to precisely point to the stop reason. This causes GDB to randomly misbehave, e.g. single step over forking code.
- Events reported from two or more events compete in the kernel for being reported to a debugger. A selection of events that lost this race will not be delivered as the winner event will overwrite signal information for a debugger from losing threads/events.
- PT_RESUME/PT_SUSPEND shares the same suspended bit as pthread_suspend_np(3) and pthread_resume_np(3) (_lwp_suspend(2), _lwp_continue(2)).
- In some circumstances event from an exiting thread never hits the tracer (WAIT() vs LWP_EXIT() race).
- Corner cases that can cause a kernel crash or kill trace can negatively effect the debugging process.
I've found that focusing on kernel correctness now and fixing thread handling bugs can have paradoxically random impact on GDB/NetBSD. The solution for multiple events reported from multiple threads concurrently has a fix in progress, but the initial changes caused some fallout in GDB support so I have decided to revert it for now. This pushed me to the conclusion that before fixing LWP events, there is a priority to streamline the GDB support: modernize it, upstream it, run regression tests.
Meanwhile there is an ongoing work on covering more kernel code paths with fuzzers. We will catch and address problems out there only because they're able to be found. I'm supervising 3 ongoing projects in this domain: syzkaller support enhancements, TriforceAFL porting and AFL+KCOV integration. This work makes the big picture of what is still needed to be fixed clearer and lowers the cost of improving the quality.
LSan/NetBSD
The original implementation of Leak Sanitizer for NetBSD was developed for GCC by Christos Zoulas. The whole magic of a functional LSan software is the Stop-The-World operation. This means that a process suspends all other threads while having the capability to investigate the register frame and the stacks of suspended threads.
Until recently there were two implementations of LSan: for Linux (ab)using ptrace(2) and for Darwin using low-level Mach interfaces. Furthermore the Linux version needs a special version of fork(2) and makes assumptions about the semantics of the signal kernel code.
The original Linux code must separately attach to each thread via a pid. This applies to all other operations, such as detaching or killing a process through ptrace(2). Additionally listing threads of a debugged process on Linux is troublesome as there is need to iterate through directories in /proc.
The implementation in GCC closely reused the semantics of Linux. There was room for enhancement. I've picked this code as an inspiration and wrote a clean implementation reflecting the NetBSD kernel behavior and interfaces. In the end the NetBSD code is simpler than the Linux code without needing any recovery fallbacks or port specific kludges (in Linux every CPU needs discrete treatment.)
Much to my chagrin, this approach abuses the ptrace(2) interface, making sanitizing for leaking programs incompatible with debuggers. The whole StopTheWorld() operation could be cleanly implemented on the kernel side as a new syscall. I have a semicompleted implementation of this syscall, however I really want to take care of all threading issues under ptrace(2) before moving on. The threading issues must be fully reliable in one domain of debugging before implementing other kernel code. Both LLVM 9.0 and NetBSD-9 are branching soon and it will be a good enough solution for the time being. My current goal before the LLVM branching is to address a semantic behavioral difference in atexit(3) that raises a false positive in LSan tests. Request for comments on this specific atexit(3) issue will be available pending feedback from upstream.
Plan for the next milestone
Modernize GDB/NetBSD support, upstream it, and run GDB regression tests for NetBSD/amd64. Switch back to addressing threading kernel issues under a debugger.
This work was sponsored by The NetBSD Foundation.
The NetBSD Foundation is a non-profit organization and welcomes any donations to help us continue funding projects and services to the open-source community. Please consider visiting the following URL to chip in what you can:
Upstream describes LLDB as a next generation, high-performance debugger. It is built on top of LLVM/Clang toolchain, and features great integration with it. At the moment, it primarily supports debugging C, C++ and ObjC code, and there is interest in extending it to more languages.
In February, I have started working on LLDB, as contracted by the NetBSD Foundation. So far I've been working on reenabling continuous integration, squashing bugs, improving NetBSD core file support and lately extending NetBSD's ptrace interface to cover more register types and fix compat32 issues. You can read more about that in my May 2019 report.
In June, I have finally finished the remaining ptrace() work
for xstate and got it merged both on NetBSD and LLDB end (meaning it's
going to make it into NetBSD 9). I have also worked on debug register
support in LLDB, effectively fixing watchpoint support. Once again
I had to fight some upstream regressions.
ptrace() XSTATE interface
In the previous report, I was comparing two approaches to resolving
unpredictable XSAVE data offsets.
Both solutions had their merits but I eventually went with having
a pair of requests with a single predictable, extensible structure.
As a result, I have implemented two new ptrace() requests:
-
PT_GETXSTATEthat obtains full FPU state and stores it instruct xstate, -
PT_SETXSTATEthat updates FPU state as requested fromstruct xstate.
The main features of this API are:
-
It provides single call to obtain all supported XSAVE components. This is especially useful for YMM or ZMM registers whose contents are split between disjoint XSAVE components.
-
It provides a
xs_rfbmbitfield that clearly indicates which XSAVE components were available, and which can be used to issue partial updates viaPT_SETXSTATE. -
It requires the caller to explicitly specify structure size. As a result, new fields (= component types) can be added to it without breaking compatibility with already built programs.
-
It provides identical API to i386 and amd64 programs, removing the need for code duplication.
-
It provides backwards compatibility with FSAVE- and FXSAVE-only systems, with
xs_rfbmclearly indicating which fields were filled. -
It can replace disjoint
PT_GETFPREGSandPT_GETXMMREGSAPIs on i386/amd64 with a single convenient method.
From user's perspective, the main gain is ability to read YMM (AVX) registers. The code supports ZMM (AVX-512) registers as well but I have not been able to test it due to lack of hardware. That said, if one of the readers is running NetBSD on AVX-512 capable CPU and is willing to help, please contact me and I'll give you some tests to run.
The two relevant commits are:
-
Fetch XSAVE area component offsets and sizes when initializing x86 CPU that obtains the necessary offsets and stores them in kernel,
-
Implement PT_GETXSTATE and PT_SETXSTATE that adds the new calls along with tests.
The two new calls are covered by tests for reading and writing MM (MMX), XMM (SSE) and YMM (AVX) registers. I have also done some work on ZMM (AVX-512) test but I did not complete it due to aforementioned lack of hardware.
On the LLDB end, the change was preceded with some bugfixes and cleanup suggested by Pavel Labath. The relevant commits are:
-
[lldb] [Process/NetBSD] Fix error handling in register operations,
-
[lldb] [Process/NetBSD] Remove unnecessary FPU presence checks for x86_64,
-
[lldb] [Process/NetBSD] Remove unnecessary register buffer abstraction,
-
[lldb] [Process] Introduce common helpers to split/recombine YMM data,
-
[lldb] [Process/NetBSD] Support reading YMM registers via PT_*XSTATE.
XSTATE in core dumps
The ptrace() XSTATE supports provides the ability to introspect registers
in running programs. However, in order to improve the support for debugging
crashed programs the respective support needs to be also added to core dumps.
NetBSD core dumps are built on ELF file format, with additional process
information stored in ELF notes. Notes can be conveniently read
via readelf -n. Each note is uniquely identified by a pair of name and numeric
type identifier. NetBSD-specific notes are split into two groups:
-
process-specific notes (shared by all LWPs) use
NetBSD-COREname and successive type numbers defined insys/exec_elf.h, -
LWP-specific notes use
NetBSD-CORE@nnwhere nn is LWP number, and type numbers corresponding toptrace()requests.
Two process-specific notes are used at the moment:
-
ELF_NOTE_NETBSD_CORE_PROCINFOcontaining process information — including killing signal information, PIDs, UIDs, GIDs… -
ELF_NOTE_NETBSD_CORE_AUXVcontaining auxiliary information provided by the dynamic linker.
The LWP-specific notes currently contain register dumps. They are stored
in the same format as returned by ptrace() calls, and use the same numeric
identifiers as PT_GET* requests.
Previously, only PT_GETREGS and PT_GETFPREGS dumps were supported. This
implies that i386 coredumps do not include MMX register values. Both requests were
handled via common code, with a TODO for providing machdep (arch-specific) hooks.
My work on core dumps involved three aspects:
-
Writing ATF tests for their correctness.
-
Providing machdep API for injecting additional arch-specific notes.
-
Injecting
PT_GETXSTATEdata into x86 core dumps.
To implement the ATF tests, I've used PT_DUMPCORE to dump core into
a temporary file with predictable filename. Afterwards, I've used libelf
to process the ELF file and locate notes in it. The note format I had to
process myself — I have included a reusable function to find and read specific
note in the tests.
Firstly, I wrote a test for process information. Then, I refactored register
tests to reduce code duplication and make writing additional variants much
easier, and created matching core dump tests for all existing PT_GET* register
tests. Finally, I implemented the support for dumping PT_GETXSTATE
information.
Of this work, only the first test was merged. The relevant commits and patches are:
LLDB debug register / watchpoint support
The next item on my TODO was fixing debug register support in LLDB. There are six debug registers on x86, and they are used to support up to four hardware breakpoints or watchpoints (each can serve as either). Those are:
-
DR0 through DR3 registers used to specify the breakpoint or watchpoint address,
-
DR6 acting as status register, indicating which debug conditions have occurred,
-
DR7 acting as control register, used to enable and configure breakpoints or watchpoints.
DR4 and DR5 are obsolete synonyms for DR6 and DR7.
For each breakpoint, the control register provides the following options:
-
Enabling it as global or local breakpoint. Global breakpoints remain active through hardware task switches, while local breakpoints are disabled on task switches.
-
Setting it to trigger on code execution (breakpoint), memory write or memory write or read (watchpoints). Read-only hardware watchpoints are not supported on x86, and are normally emulated via read/write watchpoints.
-
Specifying the size of watched memory to 1, 2, 4 or 8 bytes. 8-byte watchpoints are not supported on i386.
According to my initial examination, watchpoint support was already present in LLDB (most likely copied from relevant Linux code) but it was not working correctly. More specifically, the accesses were reported as opaque tracepoints rather than as watchpoints. While the program was correctly stopped, LLDB was not aware which watchpoint was triggered.
Upon investigating this further, I've noticed that this happens specifically because LLDB is using local watchpoints. After switching it to use global watchpoints, NetBSD started reporting triggered watchpoints correctly.
As a result, new branch of LLDB code started being used… and turned out to segfault. Therefore, my next goal was to locate the invalid memory use and correct it. In this case, the problem lied in the way thread data was stored in a list. Specifically, the program wrongly assumed that the list index will match LWP number exactly. This had two implications.
Firstly, it suffered from off-by-one error. Since LWPs start with 1, and list indexes start with 0, a single-threaded program crashed trying to access past the list. Secondly, the assumption that thread list will be always in order seemed fragile. After all, it relied on LWPs being reported with successive numbers. Therefore, I've decided to rewrite the code to iterate through thread list and locate the correct LWP explicitly.
With those two fixes, some of the watchpoint tests started passing. However, some are still failing because we are not handling threads correctly yet. According to earlier research done by Kamil Rytarowski, we need to copy debug register values into new LWPs as they are created. I am planning to work on this shortly.
Additionally, NetBSD normally disallows unprivileged processes from modifying
debug registers. This can be changed via enabling
security.models.extensions.user_set_dbregs. Since LLDB tests are normally run
via unprivileged users, I had to detect this condition from within LLDB test
suite and skip watchpoint tests appropriately.
The LLDB commits relevant to this topic are:
- [lldb] [test] Skip watchpoint tests on NetBSD if userdbregs is disabled,
- [lldb] [test] Watchpoint tests can be always run as root on NetBSD,
- [lldb] [Process/NetBSD] Fix segfault when handling watchpoint,
- [lldb] [Process/NetBSD] Use global enable bits for watchpoints.
Regressions caught by buildbot
Finally, let's go over the regressions that were caught by our buildbot instance throughout the passing month:
-
[COFF, ARM64] Add CodeView register mapping broke LLDB builds due to API incompatibility; fixed by the author: [COFF, ARM64] Fix CodeView API change for getRegisterNames;
-
Implement deduction guides for map/multimap broke libc++ builds with trunk clang; recommitted with a fix as [libc++] Take 2: Implement CTAD for map and multimap;
-
Fix a crash in option parsing broke LLDB tests on NetBSD due to relying on specific
getopt_long()output (bug?); fixed by Options: Correctly check for missing arguments; -
[ABI] Implement Windows ABI for x86_64 broke NetBSD at runtime by omitting NetBSD from list of platforms using SysV ABI; I've fixed it via [lldb] [Plugins/SysV-x86_64] NetBSD is also using SysV ABI;
-
Implement xfer:libraries-svr4:read packet changed internal LLDB API, breaking NetBSD plugin builds; I've fixed it via [lldb] [Process/NetBSD] Fix constructor after r363707;
-
Revert "Implement xfer:libraries-svr4:read packet" changed the API back and broke NetBSD again; I've reverted my change to fix it: Revert "[lldb] [Process/NetBSD] Fix constructor after r363707";
-
Change LaunchThread interface to return an expected broke builds, most likely due to GCC incompatibility; not fixed yet.
Future plans
Since Kamil has managed to move the kernel part of threading support forward, I'm going to focus on improving threading support in LLDB right now. Most notably, this includes ensuring that LLDB can properly handle multithreaded applications, and that all thread-level actions (stepping, resuming, signalling) are correctly handled. As mentoned above, this also includes handling watchpoints in threads.
Of course, I am also going to finish the work on XSTATE in coredumps, and handle any possible bugs I might have introduced in my earlier work.
Afterwards I will work on the remaining TODO items, that are:
-
Add support to backtrace through signal trampoline and extend the support to libexecinfo, unwind implementations (LLVM, nongnu). Examine adding CFI support to interfaces that need it to provide more stable backtraces (both kernel and userland).
-
Add support for i386 and aarch64 targets.
-
Stabilize LLDB and address breaking tests from the test suite.
-
Merge LLDB with the base system (under LLVM-style distribution).
This work is sponsored by The NetBSD Foundation
The NetBSD Foundation is a non-profit organization and welcomes any donations to help us continue funding projects and services to the open-source community. Please consider visiting the following URL to chip in what you can:
This report was prepared by Surya P as a part of Google Summer of Code 2019
What is DRM ioctl ?
Ioctls are input/output control system calls and DRM stands for direct rendering manager The DRM layer provides several services to graphics drivers, many of them driven by the application interfaces it provides through libdrm, the library that wraps most of the DRM ioctls. These include vblank event handling, memory management, output management, framebuffer management, command submission & fencing, suspend/resume support, and DMA services.
Native DRM ioctl calls
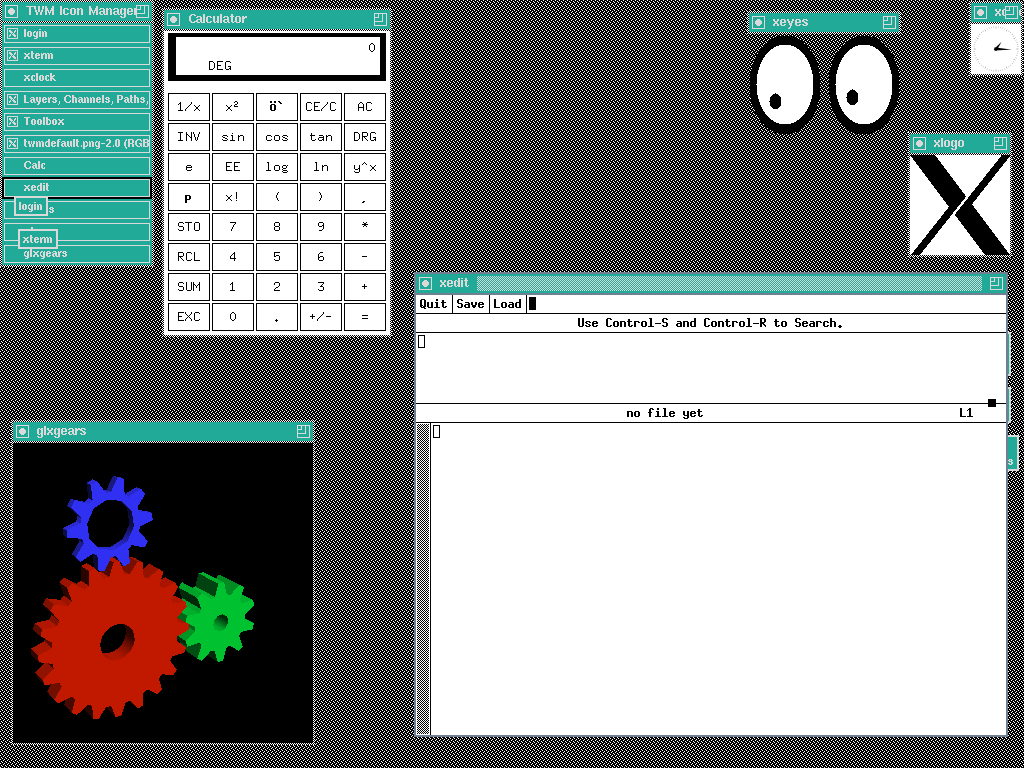
NetBSD was able to make native DRM ioctl calls with hardware rendering once xorg and proper mesa packages where installed. We used the glxinfo and glxgears applications to test this out.
DRM ioctl calls from emulation
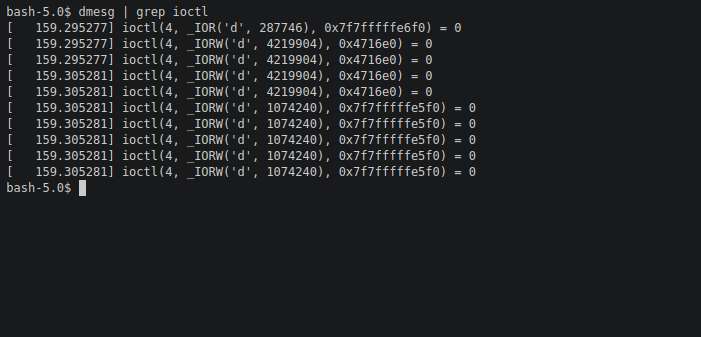
In order to make sure DRM ioctl calls where also made from the linux emulation layer of NetBSD . We used rpm and suse131 packages In specific base,compat,X11,libdrm,libglx,libexpat packages where used. To my surprise the applications kept segfaulting . I used glxgears and glxinfo rpm packages for this test .when I analyzed the segfault and traced the process , I was able to identify the cause of the segfault which was caused due to broken suse131 libdrm package which did not support nouveau based cards. To further make user that the problem was with the suse packages , I downgraded to suse121 and as expected the glxinfo and glxgears rpm packages ran, but it was using software rendering instead of hardware rendering but nevertheless we were still able to see the DRM ioctl calls made by the emulation layer hence we added some print statements in the kernel source to identify the calls made.
Summary
Fixing the Suse131 package and enabling hardware rendering from emulation is of highest priority , I have also planned to port steam and its dependencies to NetBSD to incorporate some gaming on NetBSD! And finally conversion between 32bit DRM ioctl calls 64bit DRM ioctl calls will be implemented.
Last but not the least I would like to thank my mentor @christos , @maya , @leot for helping me out and guiding me throughout the process and Google for providing me with such a wonderful opportunity to work with NetBSD community.
This report was prepared by Surya P as a part of Google Summer of Code 2019
What is DRM ioctl ?
Ioctls are input/output control system calls and DRM stands for direct rendering manager The DRM layer provides several services to graphics drivers, many of them driven by the application interfaces it provides through libdrm, the library that wraps most of the DRM ioctls. These include vblank event handling, memory management, output management, framebuffer management, command submission & fencing, suspend/resume support, and DMA services.
Native DRM ioctl calls
NetBSD was able to make native DRM ioctl calls with hardware rendering once xorg and proper mesa packages where installed. We used the glxinfo and glxgears applications to test this out.
DRM ioctl calls from emulation
In order to make sure DRM ioctl calls where also made from the linux emulation layer of NetBSD . We used rpm and suse131 packages In specific base,compat,X11,libdrm,libglx,libexpat packages where used. To my surprise the applications kept segfaulting . I used glxgears and glxinfo rpm packages for this test .when I analyzed the segfault and traced the process , I was able to identify the cause of the segfault which was caused due to broken suse131 libdrm package which did not support nouveau based cards. To further make user that the problem was with the suse packages , I downgraded to suse121 and as expected the glxinfo and glxgears rpm packages ran, but it was using software rendering instead of hardware rendering but nevertheless we were still able to see the DRM ioctl calls made by the emulation layer hence we added some print statements in the kernel source to identify the calls made.
Summary
Fixing the Suse131 package and enabling hardware rendering from emulation is of highest priority , I have also planned to port steam and its dependencies to NetBSD to incorporate some gaming on NetBSD! And finally conversion between 32bit DRM ioctl calls 64bit DRM ioctl calls will be implemented.
Last but not the least I would like to thank my mentor @christos , @maya , @leot for helping me out and guiding me throughout the process and Google for providing me with such a wonderful opportunity to work with NetBSD community.
Argon2 is a modern memory-hard hashing scheme designed by Biryukov et al.[1] Compared to currently supported hashing algorithms in NetBSD, memory-hard Argon2 provides improved resistance against Time Memory Trade-off (TMTO) and side-channel attacks. In our project, we are working to incorporate Argon2 into the local password management framework of NetBSD.
Phase 1 goals and work completed
Phase 1 of the project focused on incorporating the Argon2 reference implementation into NetBSD. As such, we focused on building the associated libraries and integrating the functionality into the existing password management framework. Our initial phase 1 goals were as follows
- Integrate Argon2 reference code into the existing build framework
- Support automated building and installation of argon2 binary and libraries
- Extend the existing password management framework to support Argon2 encoding
Towards these goals, we have added the Argon2 reference code into the external source tree and created the necessary build scripts. This work allows us to successfully add Argon2 into our system by adding MKARGON2=yes to /usr/share/mk/bsd.own.mk. After successfully building and installation, we have the following
/usr/bin/argon2
/lib/libargon2.so
/lib/libargon2.so.1
/lib/libargon2.so.1.0
We then extended the functionality of pwhash(1) and libcrypt(3) to support Argon2 encoding. Currently we support all three Argon2 variants, although not all variants are recommended (see [1][2]). We support the following standard parameters: execution time (t), memory utiltized (m), and degree of parallelism (p). Salt length is currently fixed at the recommended 16 bytes.[1]
With our phase 1 goals successfully completed, we have the following functionality available. The argon2(1) binary allows us to easily validate parameters and encodings
m2# echo -n password|argon2 somesalt -id -p 3 -m 8
Type:           Argon2id
Iterations:     3
Memory:         256 KiB
Parallelism:    3
Hash:           97f773f68715d27272490d3d2e74a2a9b06a5bca759b71eab7c02be8a453bfb9
Encoded:        $argon2id$v=19$m=256,t=3,p=3$c29tZXNhbHQ$l/dz9ocV0nJySQ09LnSiqbBqW8p1m3Hqt8Ar6KRTv7k
0.000 seconds
Verification ok
m2# pwhash -A argon2id password
$argon2id$v=19$m=4096,t=3,p=1$.SJJCiU575MDnA8s$+pjT4JsF2eLNQuLPEyhRA5LCFGQWAKsksIPl5ewTWNY
m2# pwhash -Aargon2id,p=3,m=8192  password
$argon2id$v=19$m=8192,t=3,p=3$gGs/lLnXIESuSl4H$fGuqUn2PeNeoCFqV3ASvNdkXLZ2A1wZTb2s7LTe4SE0
m1# grep -A1 testuser /etc/passwd.conf
testuser:
        localcipher = argon2i,t=6,m=4096,p=1
m1# id testuser
uid=1001(testuser) gid=100(users) groups=100(users)

m1# grep testuser /etc/master.passwd
testuser:$argon2i$v=19$m=4096,t=6,p=1$MpbO25MF2m4Y/aQT$9STuNmQLMSgYBVoQiXyDLGcb+DSHysJOQh1spI6qEuE:1001:100::0:0::/home/testuser:/sbin/nologin

m1# passwd testuser
Changing password for testuser.
New Password:
Retype New Password:

m1# grep testuser /etc/master.passwd
testuser:$argon2i$v=19$m=4096,t=6,p=1$PDd65qr6JU0Pfnpr$8YOMYcwINuKHoxIV8Q0FJHG+RP82xtmAuGep26brilU:1001:100::0:0::/home/testuser:/sbin/nologin
Plans for next phase
Phase 2 will focus on code cleanup and incorporation of any improvements suggested during review. We are also extending our ATF test-set and will begin our performance evaluation. Primary deliverables for phase 2 will be a performance evaluation.Summary
We have successfully integrated Argon2 into NetBSD using the native build framework. We have extended existing functionality to support local password management using Argon2 encoding. Moving forward in phase 2, we will work on cleanup, validation, and performance evaluation.References
[1] Biryukov, Alex, Daniel Dinu, and Dmitry Khovratovich. "Argon2: new generation of memory-hard functions for password hashing and other applications." 2016 IEEE European Symposium on Security and Privacy (EuroS&P). IEEE, 2016.[2] Alwen, Joël, and Jeremiah Blocki. "Towards practical attacks on argon2i and balloon hashing." 2017 IEEE European Symposium on Security and Privacy (EuroS&P). IEEE, 2017.
- New AArch64 architecture support:
- Symmetric and asymmetrical multiprocessing support (aka big.LITTLE)
- Support for running 32-bit binaries
- UEFI and ACPI support
- Support for SBSA/SBBR (server-class) hardware.
- The FDT-ization of many ARM boards:
- the 32-bit GENERIC kernel lists 129 different DTS configurations
- the 64-bit GENERIC64 kernel lists 74 different DTS configurations
All supported by a single kernel, without requiring per-board configurations. - Graphics driver update, matching Linux 4.4, adding support for up to Kaby Lake based Intel graphics devices.
- ZFS has been updated to a modern version and seen many bugfixes.
- New hardware-accelerated virtualization via NVMM.
- NPF performance improvements and bug fixes. A new lookup algorithm, thmap, is now the default.
- NVMe performance improvements
- Optional kernel ASLR support, and partial kernel ASLR for the default configuration.
- Kernel sanitizers:
- KLEAK, detecting memory leaks
- KASAN, detecting memory overruns
- KUBSAN, detecting undefined behaviour
These have been used together with continuous fuzzing via the syzkaller project to find many bugs that were fixed. - The removal of outdated networking components such as ISDN and all of its drivers
- The installer is now capable of performing GPT UEFI installations.
- Dramatically improved support for userland sanitizers, as well as the option to build all of NetBSD's userland using them for bug-finding.
- Update to graphics userland: Mesa was updated to 18.3.4, and llvmpipe is now available for several architectures, providing 3D graphics even in the absence of a supported GPU.
We try to test NetBSD as best as we can, but your testing can help NetBSD 9.0 a great release. Please test it and let us know of any bugs you find.
You can find binaries here.